Problem
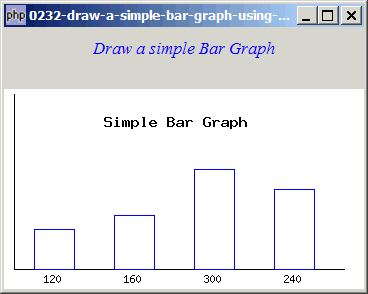
You would like to draw a simple bar graph from a set of data as shown below:

Solution
We can draw a simple bar graph using the GD2 library. For those of you who are not familiar with GD2, please refer to the PHP documentation at: http://www.php.net/gd
To run the following example, make sure you php-gtk2 is compiled with GD2 library.
Note: The Gnope Installer version DOES NOT support GD2. Please download the latest php-gtk2 binary from the official PHP-GTK site as outlined in the article How to install php gtk2 on windows?
Sample Code
| 1 2 4 5 6 7 8 9 10 11 12 13 14 15 17 18 19 20 21 22 23 24 25 26 27 28 29 30 33 34 35 36 37 38 39 43 45 46 47 48 49 50 51 52 53 55 56 57 60 61 62 63 64 65 66 69 70 73 75 76 77 78 | <?php $window = new GtkWindow(); $window->set_title($argv[0]); $window->connect_simple('destroy', array('Gtk','main_quit')); $window->add($vbox = new GtkVBox()); // display title $title = new GtkLabel("Draw a simple Bar Graph"); $title->modify_font(new PangoFontDescription("Times New Roman Italic 10")); $title->modify_fg(Gtk::STATE_NORMAL, GdkColor::parse("#0000ff")); $title->set_size_request(-1, 40); $title->set_justify(Gtk::JUSTIFY_CENTER); $alignment = new GtkAlignment(0.5, 0, 0, 0); $alignment->add($title); $vbox->pack_start($alignment, 0, 0); $vbox->pack_start(new GtkLabel(), 0, 0); draw_bargraph($vbox); // note 1 $window->show_all(); Gtk::main(); function draw_bargraph($vbox) { $data = array('120','160','300','240'); $im = imagecreate(360, 200); $white = imagecolorallocate($im,255,255,255); $black = imagecolorallocate($im,0,0,0); $blue = imagecolorallocate($im,0,0,255); // // create background box //imagerectangle($im, 1, 1, 319, 239, $black); //draw X, Y Co-Ordinate imageline($im, 10, 5, 10, 180, $black ); imageline($im, 10, 180, 340, 180, $black ); imagestring($im,6,100,25,"Simple Bar Graph", $black); // what next draw the bars $x = 30; $y = 180; $w = 40; // get into some meat now, cheese for vegetarians; for ($i=0;$i<count($data);$i++){ $y_ht = ($data[$i]/max($data))* 100; imagerectangle($im,$x,$y,$x+$w,($y-$y_ht),$blue); imagestring($im,2,$x+10,$y+3,$data[$i],$black); $x = $x+$w+40; } $pixbuf = GdkPixbuf::new_from_gd($im); // note 2 imagedestroy($im); $img = GtkImage::new_from_Pixbuf($pixbuf); // note 3 $vbox->pack_start($img); $width = $pixbuf->get_width(); $height = $pixbuf->get_height(); $img->set_size_request($width, $height); // note 4 } ?> |
Output
As shown above.
Explanation
- Draw the bar graph using GD2.
- Load the graph into GdkPixbuf.
- Create a new GtkImage from the pixbuf.
- Resize the GtkImage so that the entire bar graph is displayed.
Related Links
- How to install php gtk2 on windows?
- How to dynamically scale a bar graph using scrollbars - Part 1 - y direction?
- How to dynamically scale a bar graph using scrollbars - Part 2 - align bottom left?
- How to dynamically scale a bar graph using scrollbars - Part 3 - x direction?
- How to dynamically scale a bar graph using scrollbars - Part 4 - x and y directions?
- How to dynamically scale a bar graph using scrollbars - Part 5 - x and y directions with one scrollbar?
Read more...