Problem
This is in response to Paamayim's post titled 'smooth scrolling for a gtkimage drawing'.
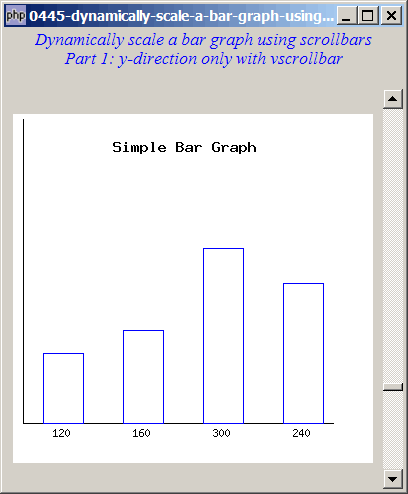
He has set up a bar graph and wants to allow the user to dynamically change the scale of the x-axis and y-axis through the scrollbars as shown below.
As there are quite a number of techniques involved, to make it easier to follow, I've spread the techniques over 5 parts:
- Part 1 (this article) - adds the vscrollbar
- Part 2 - aligns the graph to bottom left
- Part 3 - adds the hscrollbar
- Part 4 - adds both vscrollbar and hscrollbar
- Part 5 - use only one scrollbar to control scaling of both axis

Solution
- First set up the bar graph using the technique as outlined in How to draw a simple bar graph using GD2?
- Create a GtkAdjustment.
- Then create a GtkVscrollbar and attach the GtkAdjustment to the vscrollbar.
- The signal value-changed allows you to know when the user change the value through the scrollbar.
Sample Code
| 1 2 4 5 6 7 8 9 10 11 12 13 14 15 16 18 19 20 21 23 24 25 26 27 28 29 30 31 32 33 34 35 36 37 38 39 40 41 42 43 44 45 46 47 48 49 50 53 54 55 56 57 58 59 65 66 67 69 70 71 72 73 74 76 77 78 81 83 85 86 87 88 89 90 91 92 93 | <?php $window = new GtkWindow(); $window->set_title($argv[0]); $window->connect_simple('destroy', array('Gtk','main_quit')); $window->add($vbox = new GtkVBox()); // display title $title = new GtkLabel("Dynamically scale a bar graph using scrollbars\n". "Part 1: y-direction only with vscrollbar"); $title->modify_font(new PangoFontDescription("Times New Roman Italic 10")); $title->modify_fg(Gtk::STATE_NORMAL, GdkColor::parse("#0000ff")); $title->set_size_request(-1, 40); $title->set_justify(Gtk::JUSTIFY_CENTER); $alignment = new GtkAlignment(0.5, 0, 0, 0); $alignment->add($title); $vbox->pack_start($alignment, 0, 0); $vbox->pack_start(new GtkLabel(), 0, 0); setup_bargraph($vbox); $window->show_all(); Gtk::main(); function setup_bargraph($vbox) { global $img; $vbox->pack_start($hbox = new GtkHBox()); $img = new GtkImage(); $adj = new GtkAdjustment(0.87, 0.87, 2, 0.1, .5); // note 1 $vscrollbar = new GtkVScrollbar($adj); // note 2 $vscrollbar->connect('value-changed', 'on_value_changed'); // note 3 $adj->set_value(1); // note 4 $adj->value_changed(); $hbox->pack_start($img); $hbox->pack_start($vscrollbar, 0); $hbox->set_size_request(400, 400); } function draw_bargraph($x_scale, $y_scale) { global $img; $max_width = 360; $max_height = 200 * $y_scale; $margin = 40; $im = imagecreate($max_width, $max_height); $white = imagecolorallocate($im,255,255,255); $black = imagecolorallocate($im,0,0,0); $blue = imagecolorallocate($im,0,0,255); $data = array('120','160','300','240'); imageline($im, 10, 5, 10, $max_height-$margin, $black ); imageline($im, 10, $max_height-$margin, $max_width-$margin, $max_height-$margin, $black ); imagestring($im,6,100,25,"Simple Bar Graph", $black); // what next draw the bars $x = 30; $y = $max_height - $margin; $w = 40; // get into some meat now, cheese for vegetarians; for ($i=0;$i<count($data);$i++){ $y_ht = ($data[$i]/max($data))* 100 * $y_scale; imagerectangle($im,$x,$y,$x+$w,($y-$y_ht),$blue); imagestring($im,2,$x+10,$y+3,$data[$i],$black); $x = $x+$w+40; } $pixbuf = GdkPixbuf::new_from_gd ($im); $img->set_from_pixbuf($pixbuf); } function on_value_changed($adj) { $val = $adj->get_value(); // note 5 echo "new y-value: $val\n"; draw_bargraph(1.0, $val); // note 6 } ?> |
Output
As shown above.
Explanation
We make use of the code from How to draw a simple bar graph using GD2? to set up the bar graph.
What's new here:
- Create the GtkAdjustment.
- Create the vscrollbar and binds the GtkAdjustment to the scrollbar.
- Register for the signal
value-changed. - Set the initial value to 1.
- Get the current value of the Gtkadjustment/scrollbar.
- Redraw the bar graph.
Note
This example serves mainly to illustrate the use of GtkAdjustment and GtkVScrollbar. I will leave it to you to optimize and polish the gd2 portion (for the display of the bar graph).
Related Links
- How to draw a simple bar graph using GD2?
- How to dynamically scale a bar graph using scrollbars - Part 2 - align bottom left?
- How to dynamically scale a bar graph using scrollbars - Part 3 - x direction?
- How to dynamically scale a bar graph using scrollbars - Part 4 - x and y directions?
- How to dynamically scale a bar graph using scrollbars - Part 5 - x and y directions with one scrollbar?
Read more...